Last Saturday during my lecture about code quality I was a bit shocked how many people didn’t know the most accessible tools that can improve code quality. You should remember that cost of quality improvements will be low only when we will think about those issues from the early beginning of the project. Every additional day when we are not monitoring and improving quality will increase the cost of potential quality issues fixes in future.
Of course, I would assume that each time we are trying to deliver good quality code but we are only humans. So even when we do not have enough budget for refactoring, I would like to advise to start monitoring the quality of code. Then we will be able to check present status of code quality and observe the general trend. It means that we will know where we are in our project.
Let’s start with the simplest tools.
StyleCop
I will start from StyleCop. This tool allows us to keep our style of coding coherent in the team. StylCop verifies if we are using correct indentation, formatting or new lines. For some of you, this can look like something not important. Please think about a commercial project where we have a team of few developers. In such team, every developer has its style of coding. When you do not have defined common style, it is very easy to say which developer wrote parts of the code. The application code is not coherent and for new developers it is a challenge to start working with this type of code. They need to learn the style of other team members. After a while, we will have a mess in the code.
We can improve this situation by using StyleCop. This tool will verify if all of our developers are using common standards of code formatting. It is very easy to start using this tool. You need only to install StyleCop.Analyzers NuGet package:
And just after compilation, you will be able to see a list of errors that should be fixed:
FxCop
The second tool – FxCop is very similar to the previous one. It works in the same way but other errors are being checked. In case of FxCop, we will see a list of lines of code that are not following rules included in .NET Framework Design Guidelines.
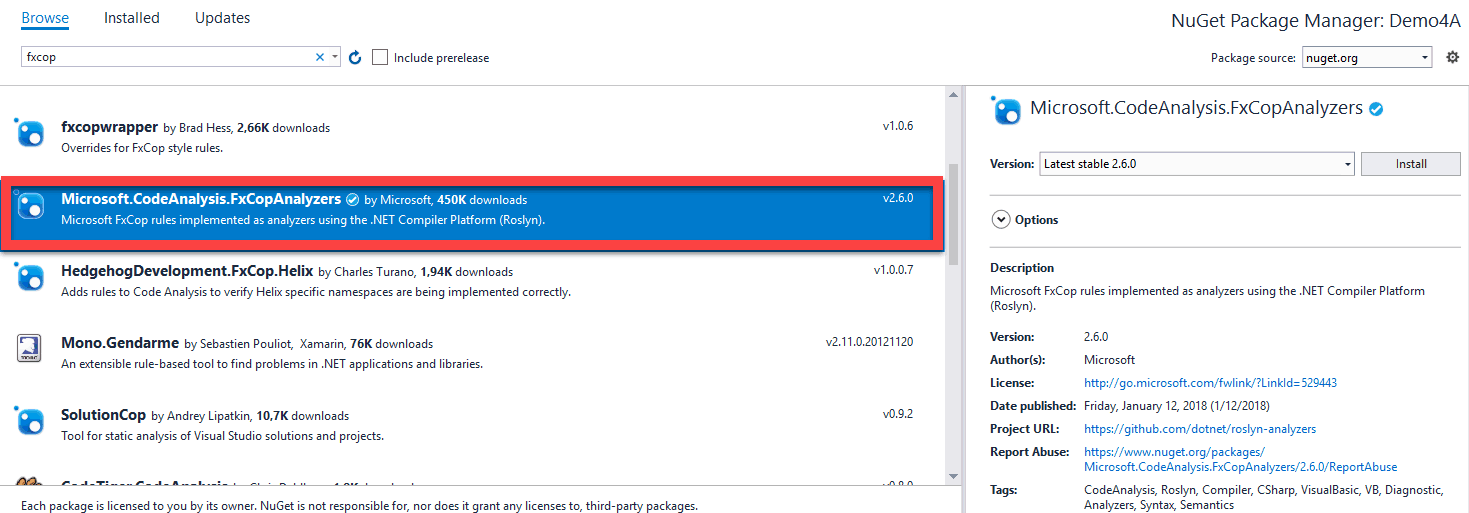
To install this tool, we need to install another NuGet package – Microsoft.CodeAnalysis.FxCopAnalyzers:
And like with StyleCop we will get a list of issues that should be fixed just after a compilation:
With those two tools, I would recommend to turn on one additional feature in Visual Studio. In Build configuration for the Release you should select All in section Treat warning as errors. Now each time when you will build your application in Release configuration, your application will not compile when there will be any of StyleCop or FxCop error:
dupFinder
DupFinder is a console tool that allows us to find all duplications in our code. It has been developed by JetBrains. To get the report you need to run this tool with correct parameters and then convert XML result to more readable form:
.\dupfinder.exe .\Code\MyProject.sln --show-text --o="report.xml"
.\msxsl.exe report.xml dupFinder.xsl -o result.html
After running those two commands you will get the report. The beginning looks like this:
You will find the information about files that contain duplicated code and also lines of that code. Based on that information you can plan refactoring actions and decide how we should handle such situations. In most cases, you will need to move such code to separate classes.
NDepend
And the last tool that I would like to mention – NDepend. It comes as an extension to Visual Studio and it has enormous potential. It is hard to describe this tool in a few words, but I will try… It can analyse the code of our application from different aspects. You need to run an analysis of our solution from time to time and then check what kind of errors we managed to introduce to our project. The list of code smells against which our code is verified is enormous. And finally after check, we will get all information gathered in one place:
Fast screening of dashboard allows you to define a place where you are with code quality of your project. You will find there a lot of information. From simple ones like code statistics to more interesting ones regarding technical debt. For me the most crucial part is regarding technical debt. Issues from this area have been presented from different perspectives. The most important stats showed technical dept in time (how it has been changing during our project) and aggregated into groups. With such information, we can plan our fixes in that way that we will start with most critical ones.
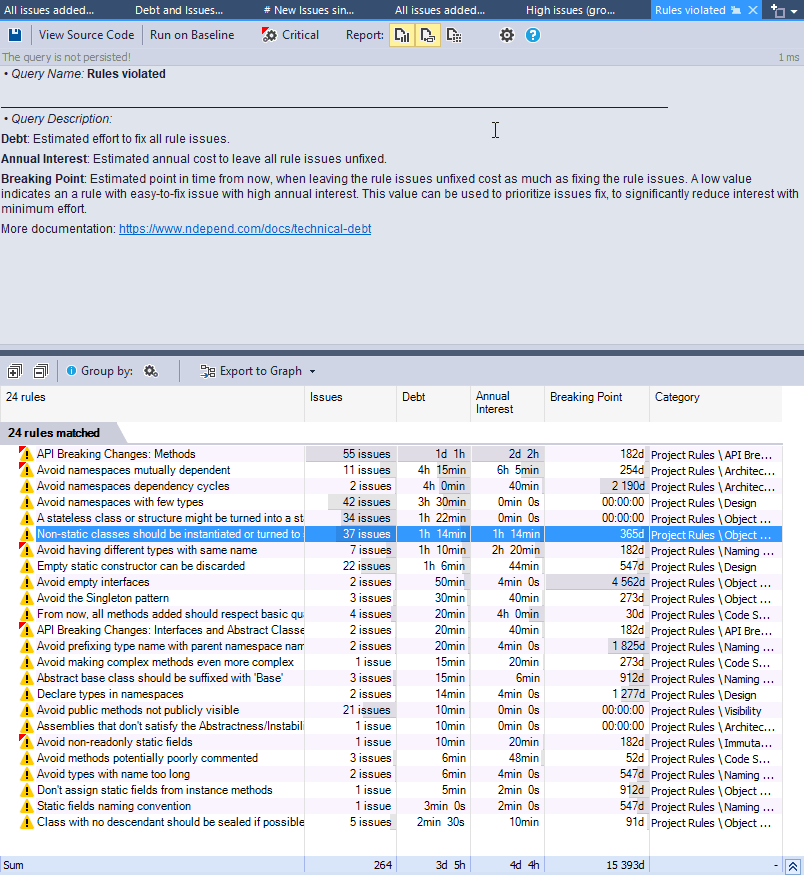
Of course by clicking on each element we will open view with more details:
I would like to encourage you to read a short review of this tools – NDepend – short review.
Summary
In the end, I would like to point out one detail. Rember that installation of those tools is not enough. You should start to analyse information provided by them. I am doing it in that way. Each month I am planning a meeting during which I am going through all data delivered by mentioned tools. I’m starting from looking on raw data, then I am verifying trend in time and finally I am trying to figure out what kind of new errors has been introduced to the application and which type of mistakes have been fixed. After such meeting, I am trying to plan actions to improve code quality that I would like to conduct during next month and I am also planning the meeting for the following review.


Leave A Comment